Category Archives: Perspectives

The Empty Side of the Field

Watching Messi score his first World Cup hat-trick recently, I found myself thinking back to weekends spent watching my kids play soccer.

At that age, the game is wonderfully simple. Wherever the ball goes, every kid follows. Half the field sits empty. Coaches shout, parents laugh.  Everyone’s watching the ball.  Nobody pays attention to the empty space.

Today’s stock market isn’t so different.  Attention is finite. Wherever it flows, something else gets left behind. Every crowded trade creates a neglected one — two sides of the same field.

Over the past year, investors have been captivated by artificial intelligence, and for good reason. We think AI is one of the most important technological developments of our lifetime, and the companies building the infrastructure behind it have created real value. In many cases, the attention is deserved.

 Earlier this year, when geopolitical tensions in the Middle East triggered a sharp correction in semiconductor stocks, we saw opportunity rather than risk. We expressed our view to investors at an event in Brisbane: the long-term demand drivers hadn’t changed just because markets had gotten nervous. So, we added to several positions, a decision that is so far looking positive. If anything, we could have leaned in harder.

Our conviction in AI hasn’t changed. Where we’re finding the next opportunity has.


Attention Has Become Exceptionally Concentrated

Investor Rob Arnott put it well: “When bubbles start in one place, there’s an anti-bubble somewhere else.”

Whether today’s AI trade becomes a bubble isn’t really the point. When everyone runs toward one opportunity, something else gets left behind — and that’s where we’re increasingly looking.

The numbers make the concentration hard to ignore. Semiconductors alone accounted for nearly 55% of global equity market returns this year. Add technology hardware and that climbs past 80%. Include industrial companies benefiting from AI infrastructure spend, and roughly 96% of total market gains came from just three industry groups1

Thousands of listed companies compete for capital every day. Almost all of the market’s gains came from a narrow slice of it.

What happened elsewhere is just as telling. Software, consumer discretionary and healthcare all detracted from market2

The market hasn’t simply turned enthusiastic about technology —based on recent outcomes, the market has been driven by one part of technology: the companies supplying the picks, shovels and infrastructure powering AI.


Looking for Open Space

None of this means the AI story is over. We still own businesses benefiting directly from AI infrastructure spending, and we remain optimistic about their long-term prospects.

But investing isn’t about identifying yesterday’s winners. It’s about identifying tomorrow’s.

As capital keeps crowding into the same handful of industries, we’re finding more to like elsewhere — businesses with large addressable markets, disruptive models, and founders still running the show. Regardless of what happens with AI, we believe these businesses can keep compounding value for years.

They rarely make headlines. They’re not discussed endlessly on financial television, and they’re rarely at the centre of the conversation.  In our view, the most attractive investments rarely begin with consensus. They begin with neglect.

 The crowd is still chasing the ball. We’re looking at the space they’ve left behind.

1 & 2. MSCI ACWI All Cap Index calendar year to 30 June 2026 contributions to return.

Disclaimer:

This material is prepared by Paradice Investment Management Pty Ltd (ABN 64 090 148 619 AFSL No 224158) (Paradice, we or us) to provide you with general information only.

This material is not intended to constitute advertising or advice (including investment advice or security, market or sector recommendations) of any kind. In addition, this material represents only the views of the Paradice Global All Cap team as at the time of release and is not intended, and may not, represent the views of Paradice or any of the other investment teams at Paradice. It does not reflect any events or changes in circumstances occurring after the date of publication

It may contain certain forward looking statements, opinions and projections that are based on the assumptions and judgments of Paradice with respect to, among other things, future economic, competitive and market conditions and future business decisions, all of which are difficult or impossible to predict accurately and many of which are beyond the control of Paradice. Because of the significant uncertainties inherent in these assumptions, opinions and judgments, you should not place undue reliance on these forward-looking statements. For the avoidance of doubt, any such forward looking statements, opinions, assumptions and/or judgments made by Paradice may not prove to be accurate or correct.

The content of this publication is current as at the date of its publication and is subject to change at any time. It does not reflect any events or changes in circumstances occurring after the date of publication.

The information and opinions contained herein, including information obtained from third party sources which are considered to be reliable, are not necessarily all-inclusive and, as such, no representation or warranty, express or implied, is made as to the accuracy, completeness or reasonableness of any assumption contained herein and no responsibility arising for errors and omissions (including responsibility to any person by reason of negligence) is accepted by Paradice, its officers, employees or agents.

Contributors:

Munish Malhotra

Further Information

Australian Banks: The Bull Market Is Over

The Regime Change: From Bull to Bear

Typically rising interest rates are good news for the major banks up to a point, as higher rates widened margins and, in our view drove the earnings growth that contributed to higher valuations. That changed in April.


We believe the sector has reached a turning point. Rate rises that previously supported earnings are now eroding credit quality as suggested by additional bank provisions. Following on from this, the same environment that drove upgrades is arguably now the source of the risk.


In our view, this isn’t just a cyclical shift. The federal government’s proposed changes to negative gearing and CGT on investment property, if implemented, could make things worse — speeding up earnings decline that was already starting to show in the numbers.

Policy Shock: Negative Gearing and CGT Reform

The government’s proposed changes to negative gearing and CGT have fundamentally altered the economics of residential property investment.

Based on recent industry discussions, for investors, removing the negative gearing tax benefit may be broadly equivalent of a 1–1.5% increase in their funding costs. Put another way, it could reduce what they can afford to pay for an established property by around 25%. That’s a significant shift, not a minor adjustment.

We do not expect new dwellings to fill the gap. They typically generate lower capital gains, which makes them far less appealing to investors chasing total return. Nor do we expect demand to simply rotate from established to new stock.

Chart 1

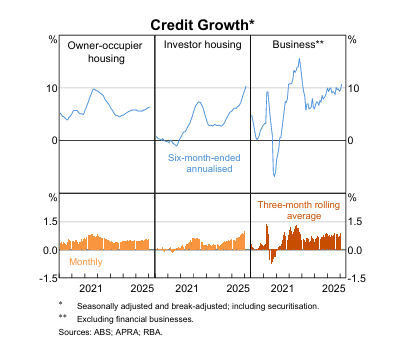
Chart 1: Investor credit growth has been flying. That is about to change. The removal of negative gearing benefits represents an effective increase of 1–1.5% in investor funding costs, or equivalently a ~25% reduction in the price investors can afford to pay for established property.

What This Means for Housing

When investors pull back, turnover typically falls. And investor participation has been the engine of the housing market — they are currently estimated to account for around 40% of new lending flow, despite being only 20% of the banks’ back book, informed by recent property industry discussions. That gap highlights how important they’ve been to volume growth over the past two years.

We expect investor credit growth may slow from 7–8% today to around 3–4% as investor flow trends toward zero, informed by these same industry discussions. We are already seeing a negative effect on house prices with the prospect of prices remaining subdued for some time. Fewer buyers, higher effective costs and stretched affordability, may not leave much room for prices to hold up.

What This Means for the Banks

Lower house prices, slower credit growth and higher interest rates are generally a difficult combination for bank earnings. We expect downgrades may occur in coming quarters. How severe they are will depend on where rates and credit growth settle — but the direction appears clear.

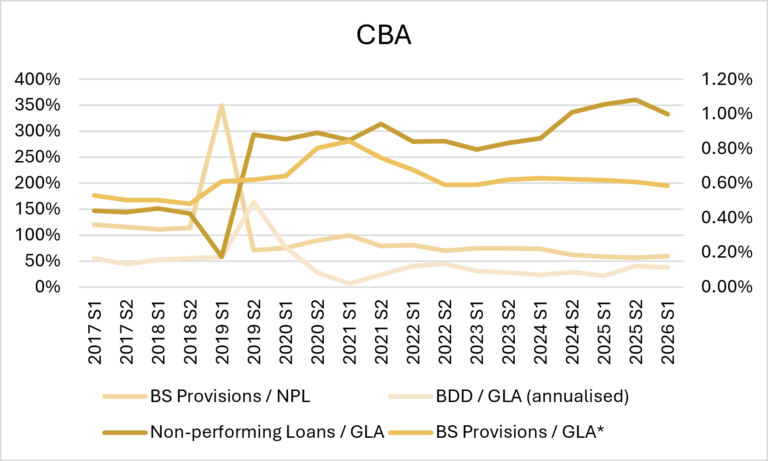
On credit quality, the banks will tell you their provisioning is adequate. We don’t agree — except in the most benign outcomes. Using CBA as an example, non-performing loans have been rising for four consecutive halves. The reason this hasn’t yet translated into actual losses is straightforward: high house and other asset prices have meant borrowers in difficulty could sell and cover their obligations. No forced sales, no losses.

As prices fall, that stops being true. Financial stress will likely rise, provisioning may need to follow, and the cycle will begin to resemble previous ones.

Chart 2

Chart 2: Paradice, CBA Non-performing loans to gross loans and acceptances have been elevated since post-COVID. These have not resulted in ultimate losses principally as a result of elevated asset (house and other) prices. As those prices retreat, this buffer disappears.

Valuation

At the time of writing, the banks are trading at 1.5–3.5x book value. That’s hard to justify in a stable environment. In a deteriorating one, it’s arguably very hard to justify. When you stress-test returns on equity against lower volumes, margin pressure and higher impairments, valuations closer to book value may look more appropriate.
Earnings downgrades could put a spotlight on these multiples. When both earnings and valuation move against you at the same time, a re-rating often tends to be swift.

In Summary

The proposed changes to negative gearing and CGT are, in our view, bad for the domestic economy and, by extension, for the Australian banking sector. We are cautious on the sector and recommend an underweight position relative to benchmark.

Disclaimer:

This material is prepared by Paradice Investment Management Pty Ltd (ABN 64 090 148 619 AFSL No 224158) (Paradice, we or us) to provide you with general information only. This material is not intended to constitute advertising or advice (including investment advice or security, market or sector recommendations) of any kind. In addition, this material represents only the views of the Paradice Australian Equities team as at the time of release and is not intended, and may not, represent the views of Paradice or any of the other investment teams at Paradice.


It may contain certain forward looking statements, opinions and projections that are based on the assumptions and judgments of Paradice with respect to, among other things, future economic, competitive and market conditions and future business decisions, all of which are difficult or impossible to predict accurately and many of which are beyond the control of Paradice. Because of the significant uncertainties inherent in these assumptions, opinions and judgments, you should not place undue reliance on these forward looking statements. For the avoidance of doubt, any such forward looking statements, opinions, assumptions and/or judgments made by Paradice may not prove to be accurate or correct.


The content of this publication is current as at the date of its publication and is subject to change at any time. It does not reflect any events or changes in circumstances occurring after the date of publication.


The information and opinions contained herein, including information obtained from third party sources which are considered to be reliable, are not necessarily all-inclusive and, as such, no representation or warranty, express or implied, is made as to the accuracy, completeness or reasonableness of any assumption contained herein and no responsibility arising for errors and omissions (including responsibility to any person by reason of negligence) is accepted by Paradice, its officers, employees or agents.

Table of Content

Contributors:

Julia Weng

Further Information

Capturing Alpha: How Long/Short Strategies Can Improve Total Portfolio Outcomes

The Problem with Long-Only in a Concentrated Market

For Australian investors, the challenge of generating consistent excess returns in long-only equity has become increasingly apparent. The ASX 200 is dominated by a handful of large financials and resources companies, and the performance of the broader index is often driven by a small number of names. Managers who are underweight these names for fundamental reasons can find themselves persistently dragging on relative performance—not because their views are wrong, but because the benchmark composition works against them.

This is compounded by a global trend. As Goldman Sachs Prime Services noted in their June 2025 analysis, traditional active equity managers globally have struggled materially in recent years1, with the average fund underperforming its benchmark by 1.5% in 2024 alone. The concentration of market returns in the largest stocks has been cited as a significant contributing factor2.

Active extension strategies offer a structural response to this challenge—not bytaking more market risk, but by expanding the universe of alpha opportunities available to the manager.

The Mathematics of Extended Alpha

Consider a skilled manager with genuine stock-selection ability. In a long-only portfolio, that skill can be applied to long positions only. In an active extension fund—say, a 135/35—the same manager can express views on approximately 170% of the portfolio’s capital. This does not change the fund’s net market exposure (which remains at 100%), but it dramatically increases the number of active positions contributing to alpha.

The Morgan Stanley research framework describes this as expanding the “alpha hunting ground.” Their analysis demonstrated that the additional tracking error generated by a 35% active extension is modest—rising from approximately 3.5% for a long-only portfolio to around 4.3%—while the potential uplift in portfolio alpha can be more notable3.

For an Australian fund benchmarked to the ASX 200, this is a meaningful consideration. The short book can be used not just to express negative views on individual stocks, but to reduce sector concentrations, offset factor tilts (such as inadvertent value or small-cap biases in the long book), and facilitate pair trades between related names. These are tools that long-only managers simply do not have.

The Fund-Level Impact

One of the most compelling arguments for active extension strategies—and one that is often underappreciated—is the fund-level risk arithmetic.

For most institutional and high-net-worth portfolios, the dominant source of volatility is equity beta. Whether a portfolio holds 50% or 70% in equities, the co-movement of those holdings with the broader market typically accounts for 90% or more of total portfolio volatility. This means that incremental tracking error from an active equity strategy—which by definition is uncorrelated with the market beta—is largely absorbed at the total portfolio level.

In practice, moving from a long-only active equity allocation to an active extension allocation of equivalent size generally produces only a very small increase in total portfolio volatility, while the alpha contribution (weighted by the allocation) flows directly to the fund’s expected return. The asymmetry is favourable: a modest increase in tracking error in exchange for a potentiallmeaningful improvement in expected alpha.

Evidence From the Market

The Goldman Sachs data analysed across global hedge fund-managed beta-1 strategies is instructive. Over the five years to end-2024, active extension products generated annualised excess returns of 5.8%, compared to 2.3% for long-only products—a difference of more than 3.5% per year. The information ratio improvement was also significant, suggesting this outperformance was not simply a function of taking more risk.

In the Australian context, where market concentration is high and sector dynamics are well understood by experienced local managers, the conditions for short alpha generation are arguably even more favourable than in more efficiently priced global markets.

Practical Considerations for Advisors

For advisors considering an active extension allocation, several practical points are worth noting.

  1. Active extension funds can typically sit within the same asset allocation bucket as traditional active equity—they are not alternatives, and do not require reclassification of the portfolio structure. The beta-1 profile ensures the portfolio’s equity exposure target is preserved.
  2. Manager selection is critical. The short book requires genuine skill and operational infrastructure—it is not sufficient to simply be good at picking longs. Advisors should assess a manager’s track record on both sides of the book, their risk management discipline, and their organisational capability to manage short positions efficiently.
  3. Fee structures for active extension products are generally more attractive than equivalent hedge fund offerings, and performance fees—where charged—are typically benchmarked against the equity index, ensuring alignment of interests.

Key Takeaway

Active extension strategies can offer a disciplined, practical way to improve the quality of equity alpha without meaningfully changing portfolio risk. The evidence is clear: more room for alpha opportunities, only marginally more tracking error, and a favourable trade-off at the total fund level. For advisors navigating concentrated markets and persistent long-only headwinds, this approach deserves serious considerationIt’s not about complexity for its own sake—it’s about giving skilled managers the tools to do what they do best.

1. Since 2020
2. Goldman Sachs: Insights in Brief: ‘Beta Times Ahead’, June 2025
3. Morgan Stanley Research, Active Extensions: Alpha Hunting and the Fund Level, December 2006

Disclaimer: This material is prepared by Paradice Investment Management Pty Ltd (ABN 64 090 148 619 AFSL No 224158) (Paradice, we or us) to provide you with general information only.  This material is not intended to constitute advertising or advice (including investment advice or security, market or sector recommendations) of any kind.  

These materials are not to be distributedand must not be copied, reproduced, published, disclosed or passed to any other person at any time without the prior written consent of Paradice.  

It may contain certain statements, opinions and projections that are based on the assumptions and judgments of Paradice with respect to, among other things, economic, competitive and market conditions and future business decisions, all of which are difficult or impossible to predict accurately and many of which are beyond the control of Paradice. Because of the significant uncertainties inherent in these assumptions, opinions and judgments, you should not place undue reliance on these statements.  

The information and opinions contained herein are not necessarily all-inclusive and, as such, no representation or warranty, express or implied, is made as to the accuracy, completeness or reasonableness of any assumption contained herein and no responsibility arising for errors and omissions (including responsibility to any person by reason of negligence) is accepted by Paradice, its officers, employees or agents and before any action or decision is taken on the basis of this material you should obtain appropriate independent professional advice, as necessary. 

Table of Content

Contributors:

Tom Richardson

Further Information

The Case for Long/Short Equity: Understanding Strategies, Approaches & Key Terms

Why Long/Short Equity Matters Now?

Australian advisors and their clients are increasingly asking a pointed question: in a market with no shortage of talented managers, why is consistent outperformance so elusive? The answer lies not in the quality of ideas, but in the structural constraints placed on how those ideas can be expressed.

Traditional long-only funds can only profit when a stock goes up. They are structurally limited in their ability to act on negative views—a manager who believes a stock is overvalued can, at best, hold less of it than the benchmark. This is a significant constraint, and it is one that long/short equity strategies are specifically designed to overcome.

What Is Long/Short Equity?

Long/short equity is a broad category of strategies that hold both long positions (stocks the manager expects to outperform) and short positions (stocks the manager expects to underperform). The short positions are typically funded by borrowing shares, selling them, and seeking to repurchase them later at a lower price. The resulting proceeds can then be reinvested into additional long positions.

This family of strategies spans a wide spectrum, and understanding where a fund sits on that spectrum matters for advisors.

The Spectrum of Strategies

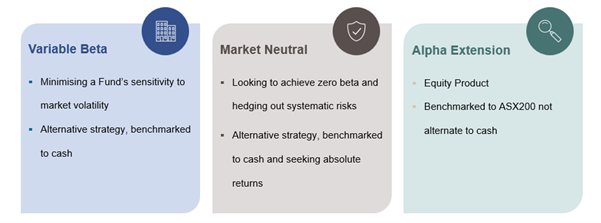
At one end sits the market-neutral fund—constructed to have near-zero net exposure to the market. These funds aim to profit purely from the spread between their long and short books, regardless of market direction. They tend to have low beta, low correlation to equity indices, and are usually housed within alternatives allocations.

At the other end are concentrated long/short funds, which maintain meaningful net long exposure but use shorts to express high-conviction negative views. These can carry significant market sensitivity and behave more like active equity funds with extra tools.

In the middle—and of particular relevance to Australian investors—sits the active extension strategy. Sometimes called a 130/30 (or 135/35, 140/40), these funds maintain a 100% net long exposure to the market, typically benchmarked to an index like the ASX 200. They are permitted to short a defined percentage of the portfolio (say, 30%), with the proceeds reinvested into additional longs (hence “extension”). The result: the same market beta as a traditional equity fund, but a materially expanded opportunity set.


Why Australia Is Well Suited

The ASX 200 is a concentrated index, with the top 10 stocks representing a substantial share of total market capitalisation. In long-only portfolios, underweighting these large-cap names is difficult—there is a limit to how negative you can be on a stock that makes up 8% of the benchmark. Active extension strategies remove this constraint, allowing managers to express their full conviction without the distortions imposed by benchmark composition.


Additionally, Australian markets have historically shown good dispersion at the stock level—meaning individual companies diverge meaningfully in their performance. High dispersion is the environment in which skilled active managers can thrive, and in which short books can add the most value.

Key Takeaway

Long/short equity isn’t always about taking more risk—it’s about removing the structural handcuffs that prevent skilled managers from fully expressing their views. Active extension strategies generally offer the same market exposure as traditional equity funds while significantly expanding the opportunity set for alpha generation. For Australian portfolios navigating a concentrated index, this can be a meaningful advantage.

The structure makes sense on paper—but the proof is in the outcomes. In our next insight, Capturing Alpha, we take a clear-eyed look at the evidence and show how active extension strategies have the potential to strengthen risk-adjusted returns without changing the fundamentals of your equity allocation.

Appendix: Key Terms

  • Net exposure: Longs minus shorts, expressed as a percentage of the portfolio. An active extension fund targets 100% net long—the same as a traditional equity fund (without taking into account the impact of gross exposure and leverage) — making it straightforward to categorise within existing asset allocation frameworks.

  • Gross exposure: Longs plus shorts combined. A 130/30 fund has 160% gross exposure, meaning the total capital at work is greater than the portfolio’s NAV. This leverage is what enables the extended alpha opportunity.

  • Tracking error: Measures how much a fund’s returns deviate from its benchmark. Active extension funds typically have moderate tracking error—higher than an index fund, but often comparable to, or only modestly above, a well-managed active long-only fund. The added tools do not necessarily mean dramatically more risk relative to benchmark.

  • Alpha: The return generated above the benchmark on a risk-adjusted basis. Long/short strategies can generate alpha from both sides: by overweighting stocks that outperform and—as opposed to long only funds—by profiting from stocks that underperform.

  • Short alpha: Often the most underappreciated source of value in these strategies. In Australian markets, where certain sectors have historically exhibited persistent overvaluation or structural decline, the ability to act on these views is genuinely additive.

Disclaimer:

This material is prepared by Paradice Investment Management Pty Ltd (ABN 64 090 148 619 AFSL No 224158) (Paradice, we or us) to provide you with general information only. This material is not intended to constitute advertising or advice (including investment advice or security, market or sector recommendations) of any kind. These materials are not to be distributed and must not be copied, reproduced, published, disclosed or passed to any other person at any time without the prior written consent of Paradice.

It may contain certain statements, opinions and projections that are based on the assumptions and judgments of Paradice with respect to, among other things, economic, competitive and market conditions and future business decisions, all of which are difficult or impossible to predict accurately and many of which are beyond the control of Paradice. Because of the significant uncertainties inherent in these assumptions, opinions and judgments, you should not place undue reliance on these statements and before any action or decision is taken on the basis of this material you should obtain appropriate independent professional advice, as necessary.

The information and opinions contained herein are not necessarily all-inclusive and, as such, no representation or warranty, express or implied, is made as to the accuracy, completeness or reasonableness of any assumption contained herein and no responsibility arising for errors and omissions (including responsibility to any person by reason of negligence) is accepted by Paradice, its officers, employees or agents.

Table of Content

Contributors:

Tom Richardson

Further Information

AI and SaaS: Looking Beyond the Hype to the Opportunity

The conversation around AI and software disruption has become increasingly noisy and SaaS company valuations have come under pressure as the market questions how sustainable some business models will be as AI models and agents become more capable. 

Whilst we cannot have certainty, we believe the market may be overestimating the intermediary risk AI poses to many SaaS companies on the ASX200.  In our view AI is a useful tool which enables SaaS to do more with less, rather than replace them entirely and likely places greater emphasis on enduring drivers of business success such as data ownership, regulatory depth and customer trust.  

The “Thin Middle” Squeeze

The old model was simple. Users worked through a SaaS interface—dashboards, workflows, integrations—which sat on top of systems of record holding the underlying data.  

AI is compressing this. Autonomous agents increasingly do the work directly, squeezing the traditional UI layer as value shifts in two directions—up to the AI layer, and down to the systems of record that agents rely on. We think of this as the “thin middle” squeeze. 

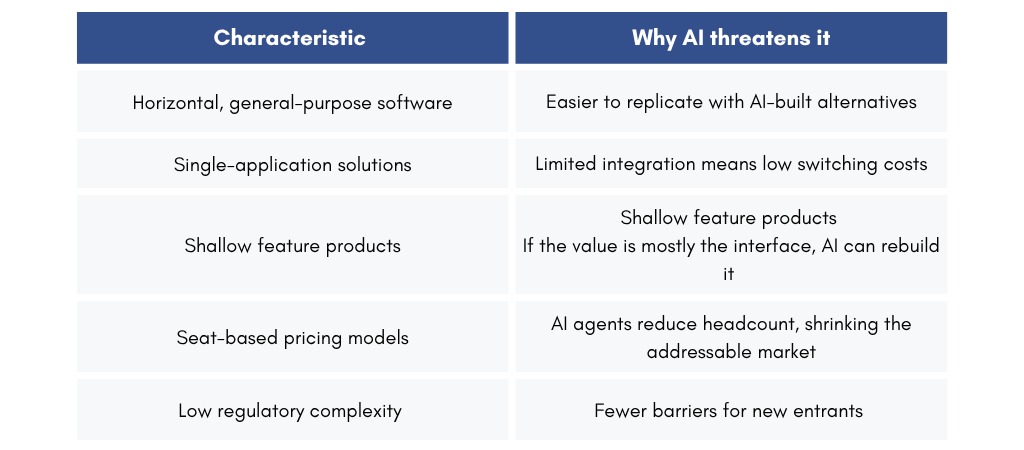
SaaS businesses whose main value is their interface—rather than their data or workflow integration—face the most pressure. 

What AI does and doesn’t disrupt

AI makes it significantly easier to build features. What once took months of engineering can now be prototyped in days. This represents a genuine leap forward in innovation and the speed of product launches. However, AI doesn’t lower barriers to: 

  • Distribution — Reaching customers at scale still needs sales infrastructure, brand recognition, and market presence. You can’t prompt-engineer your way to enterprise relationships. 
  • Data ownership — Proprietary, domain specific datasets built over years of customer activity remain hard to replicate. AI models are only as useful as the data behind them. 
  • Regulatory embedding — Deep compliance knowledge, government relationships, and certification processes take time to build. AI doesn’t shortcut this.
  • Customer trust — Enterprise buyers don’t swap mission-critical systems for a clever new feature. Switching costs, integration depth, and proven reliability still matter. 

Where we see higher disruption risk: 

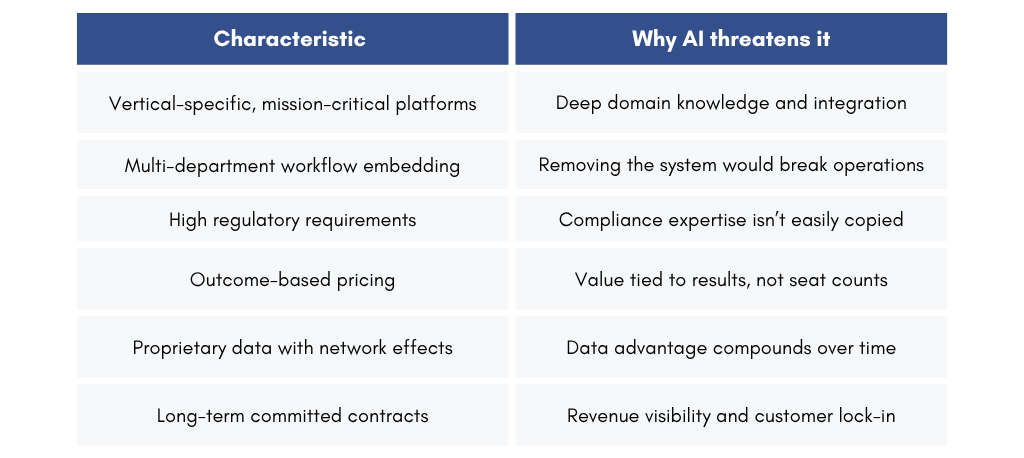
Where we see lower disruption risk: 

What we’re seeing in practice

Across our SaaS holdings, we have not seen genuine AI-driven competitive threats emerge. What we’re seeing is the opposite: companies using AI to reinforce their strengths and move faster on product development. We’re seeing this pattern repeat. Businesses with proprietary data, embedded workflows, and real domain expertise are using AI to extend their lead, not defend against erosion. 

Even Anthropic, at “Enterprise Agents” briefing on 24 Feb 2026, highlighted collaboration with leading SaaS companies to further accelerate AI monetisation features.   

We are however mindful that the advent of AI and increased cost of inferencing (querying the underlying data) may lead to SAAS companies having to re-engineer their revenue models. Possible changes could include a move from seat based or per using pricing to a model that captures the value of the work being done and the cost of compute to carry it out. An example of which might be a more transaction-based pricing outcome than a purely per user based model 

We have been selectively adding to SaaS companies within the portfolio as valuation has increasingly become more attractive. For the first time in a long time, some of these companies are growing faster and cheaper than ASX ex Resources, with better cashflow and balance sheet characteristics. 

Disclaimer:

This material is prepared by Paradice Investment Management Pty Ltd (ABN 64 090 148 619 AFSL No 224158) (Paradice, we or us) to provide you with general information only.

This material is not intended to constitute advertising or advice (including investment advice or security, market or sector recommendations) of any kind. In addition, this material represents only the views of the Paradice Australian Equities team as at the time of release and is not intended, and may not, represent the views of Paradice or any of the other investment teams at Paradice.

It may contain certain forward looking statements, opinions and projections that are based on the assumptions and judgments of Paradice with respect to, among other things, future economic, competitive and market conditions and future business decisions, all of which are difficult or impossible to predict accurately and many of which are beyond the control of Paradice. Because of the significant uncertainties inherent in these assumptions, opinions and judgments, you should not place undue reliance on these forward looking statements. For the avoidance of doubt, any such forward looking statements, opinions, assumptions and/or judgments made by Paradice may not prove to be accurate or correct.

The content of this publication is current as at the date of its publication and is subject to change at any time. It does not reflect any events or changes in circumstances occurring after the date of publication.

The information and opinions contained herein, including information obtained from third party sources which are considered to be reliable, are not necessarily all-inclusive and, as such, no representation or warranty, express or implied, is made as to the accuracy, completeness or reasonableness of any assumption contained herein and no responsibility arising for errors and omissions (including responsibility to any person by reason of negligence) is accepted by Paradice, its officers, employees or agents.

Table of Content

Contributors:

Julia Weng

Further Information

Post Reporting Season Wrap

Disclaimer:

This material is prepared by Paradice Investment Management Pty Ltd (ABN 64 090 148 619, AFSL No. 224158) (Paradice, we or us) to provide you with general information only. This material (or contribution to it) is not intended to constitute advertising or advice (including legal, tax or investment advice or security recommendation) of any kind.  It is not intended to take the place of professional advice and you should not take action on specific issues in reliance on this information. 

Equity Trustees Limited (ABN 46 004 031 298, AFSL No. 240975) (Equity Trustees) is the responsible entity of, and issuer of units in, the Paradice Funds (Fund(s)). Equity Trustees is a subsidiary of EQT Holdings Limited (ABN 22 607 797 615), a publicly listed company on the Australian Securities Exchange (ASX:EQT).  In deciding whether to acquire, or to continue to hold, units in the Funds please read the current product disclosure statement which is available by visitingwww.paradice.com and the Target Market Determination (TMD) which is available at www.paradice.com/au/investor-centre/. A TMD describes who this financial product is likely to be appropriate for (i.e. the target market), and any conditions around how the product can be distributed to investors. 

Past performance of the Funds is not a reliable indicator of future performance. The value of an investment in the Funds may rise or fall. Returns are not guaranteed by any person.  Paradice may have a relevant interest, in their capacity as investment manager, in the securities mentioned in this interview. In addition, this material represents only the views of each specific investment team as at the time of release and is not intended, and may not, represent the views of Paradice or any of the other investment teams at Paradice. 

This material may contain certain forward looking statements, opinions and projections that are based on the assumptions and judgments of Paradice with respect to, among other things, future economic, competitive and market conditions and future business decisions, all of which are difficult or impossible to predict accurately and many of which are beyond the control of Paradice. Because of the significant uncertainties inherent in these assumptions and judgments, you should not place undue reliance on these forward looking statements, nor should you regard the inclusion of these statements as a representation by Paradice that the strategy objectives will be achieved. For the avoidance of doubt, any such forward looking statements, opinions, assumptions and/or judgments made by Paradice may not prove to be accurate or correct. The information and opinions contained in this material have been and any third party data contained herein is obtained from sources considered to be reliable, but neither Paradice, nor any of its related parties, directors or employees make any representations or guarantees with regard to the accuracy of such data. The content of this publication is current as at the date of its publication and is subject to change at any time. It does not reflect any events or changes in circumstances occurring after the date of publication.

This material is not to be copied, reproduced or published at any time without the prior written consent of Paradice. Neither Paradice, Equity Trustees, nor any of their respective related parties, directors or employees, make any representation or warranty as to the accuracy, completeness, reasonableness or reliability of the information contained in this publication or accept liability or responsibility for any losses, whether direct, indirect or consequential, relating to, or arising from, the use or reliance on any part of this material. 

PIM

Contributors:

Jovana Gagic

Tom Richardson

Julia Weng

Sam Theodore

Report: Observations from Paris Trip

In September, Toby Shute, an analyst on the Global equities team, attended a pan-European equities conference hosted by Kepler Cheuvreux in Paris. He participated in 17 group and one-on-one company meetings over the course of three days. This provided a good opportunity to check in with firms that the Global team either owns or has studied in the past, in addition to meeting several others for the first time. The conference setting also provided an opportunity to compare notes and trade war stories with other Global and European-specialist investors.

Read the report here.

Disclaimer:

Not for onward distribution.
This material is prepared by Paradice Investment Management Pty Ltd (ABN 64 090 148 619 AFSL No 224158) (Paradice, we or us). This material is not intended to constitute advertising or advice (including investment advice or security, market or sector recommendations) of any kind. In addition, this material represents only the views of the Paradice Global Equities team as at the time of release and is not intended, and may not, represent the views of Paradice or any of the other investment teams at Paradice. It does not reflect any events or changes in circumstances occurring after the date of publication.
It may contain certain forward looking statements, opinions and projections that are based on the assumptions and judgments of Paradice with respect to, among other things, future economic, competitive and market conditions and future business decisions, all of which are difficult or impossible to predict accurately and many of which are beyond the control of Paradice. Because of the significant uncertainties inherent in these assumptions, opinions and judgments, you should not place undue reliance on these forward looking statements. For the avoidance of doubt, any such forward looking statements, opinions, assumptions and/or judgments made by Paradice may not prove to be accurate or correct. You should perform your own research and due diligence, consult your own financial, legal, and tax advisors before making any investment decision with respect to transacting in any securities covered herein. Following publication of this material, the investment teams at Paradice may transact or continue to transact in any of the securities covered herein, and may be positive, negative or neutral at any time hereafter regardless of our initial conclusions, or opinions.
This material is not to be copied, reproduced or published at any time without the prior written consent of Paradice. Paradice or any of their respective related parties, directors or employees, make any representation or warranty as to the accuracy, completeness, reasonableness or reliability of the information contained in this publication or accept liability or responsibility for any losses, whether direct, indirect or consequential, relating to, or arising from, the use or reliance on any part of this material.
The information and opinions contained herein, including information obtained from third party sources which are considered to be reliable, are not necessarily all inclusive and, as such, no representation or warranty, express or implied, is made as to the accuracy, completeness or reasonableness of any assumption contained herein and no responsibility arising for errors and omissions (including responsibility to any person by reason of negligence) is accepted by Paradice, its officers, employees or agents.
Copyright© 2024 Paradice

Contributors:

Toby Shute

Further Information

Report: Observations from China and USA Trip – Paradice Australian Equities Strategy

Recently David Feng, a portfolio manager/analyst from the Australian equities team, undertook a three-week trip to China and the US. Below is an update on the local economy and a view of in-trend topics from those locations. The trip comprised of company visits, interviews with industry contacts and experts, meetings with sector analysts, and conferences with participants from both listed and unlisted companies.

Read the report here.

Disclaimer:

This material is prepared by Paradice Investment Management Pty Ltd (ABN 64 090 148 619 AFSL No 224158) (Paradice, we or us).
This material is not intended to constitute advertising or advice (including investment advice or security, market or sector recommendations) of any kind. In addition, this material represents only the views of the Paradice Australian Equities team as at the time of release and is not intended, and may not, represent the views of Paradice or any of the other investment teams at Paradice. It does not reflect any events or changes in circumstances occurring after the date of publication.
It may contain certain forward looking statements, opinions and projections that are based on the assumptions and judgments of Paradice with respect to, among other things, future economic, competitive and market conditions and future business decisions, all of which are difficult or impossible to predict accurately and many of which are beyond the control of Paradice. Because of the significant uncertainties inherent in these assumptions, opinions and judgments, you should not place undue reliance on these forward looking statements. For the avoidance of doubt, any such forward looking statements, opinions, assumptions and/or judgments made by Paradice may not prove to be accurate or correct. You should perform your own research and due diligence, consult your own financial, legal, and tax advisors before making any investment decision with respect to transacting in any securities covered herein. Following publication of this material, the investment teams at Paradice may transact or continue to transact in any of the securities covered herein, and may be positive, negative or neutral at any time hereafter regardless of our initial conclusions, or opinions.
This material is not to be copied, reproduced or published at any time without the prior written consent of Paradice. Paradice or any of their respective related parties, directors or employees, make any representation or warranty as to the accuracy, completeness, reasonableness or reliability of the information contained in this publication or accept liability or responsibility for any losses, whether direct, indirect or consequential, relating to, or arising from, the use or reliance on any part of this material.
The information and opinions contained herein, including information obtained from third party sources which are considered to be reliable, are not necessarily all inclusive and, as such, no representation or warranty, express or implied, is made as to the accuracy, completeness or reasonableness of any assumption contained herein and no responsibility arising for errors and omissions (including responsibility to any person by reason of negligence) is accepted by Paradice, its officers, employees or agents.

Contributors:

David Feng

Further Information

Report: Is there an opportunity to invest in Australian Small Caps now?

 
This thought piece discusses what we are seeing in the small cap space in the US and whether this suggests that there are opportunities within the Australian small cap market.

Are US small cap stocks setting the scene?

There has been a lot of commentary and media recently talking about the great rotation currently underway globally out of large caps and into small caps.

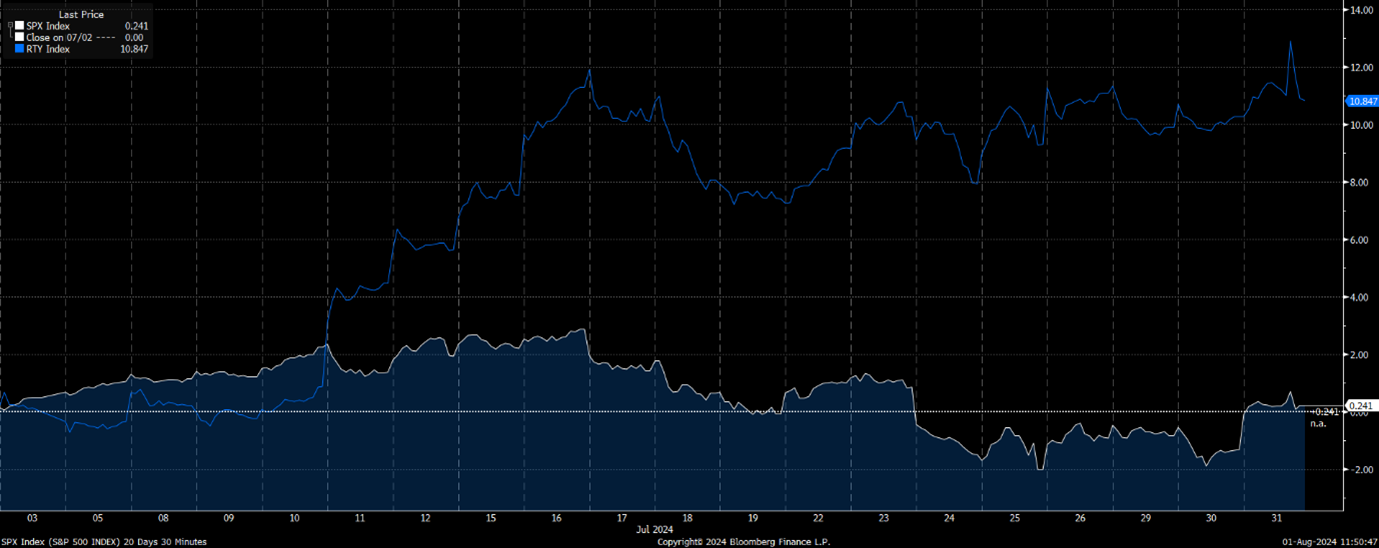
Below is a chart of the Russell 2000 (blue line; representing US Small Caps) vs the S&P 500 (white line; US Large Caps) over the last month, which illustrates close to a 10% performance difference between the two indices.

(Source: Internal, Bloomberg, as at 1 August 2024)

Why might this rotation be happening and what does it mean in an Australian context? 

  • In our view, AI is an expense at the moment rather than a revenue generator. This goes to the cost of building out the infrastructure for AI and the lag as capacity fills up before returns come.
  • Concentration risk may be playing out. The 10 largest stocks by market capitalisation in the S&P 500 accounted for 27% of the index at the end of 2023, nearly double the 14% share of a decade earlier (source: Morgan Stanley). This has increased to 37% in 2024 according to FactSet data, with the Magnificent Seven making up 31% of the index. That rate of increase in concentration is the most rapid since 1950, according to Morgan Stanley. In our view the Magnificent Seven will have to keep positively surprising on earnings to maintain that momentum.[1]  
  • The rotation began after the June 2024 CPI. In our view, this will get stronger when interest rate cuts begin to materialise and the move in US small caps over the last month suggests conviction on the rotation growing, a trajectory which could play out similarly in an Australian context as outlined below.

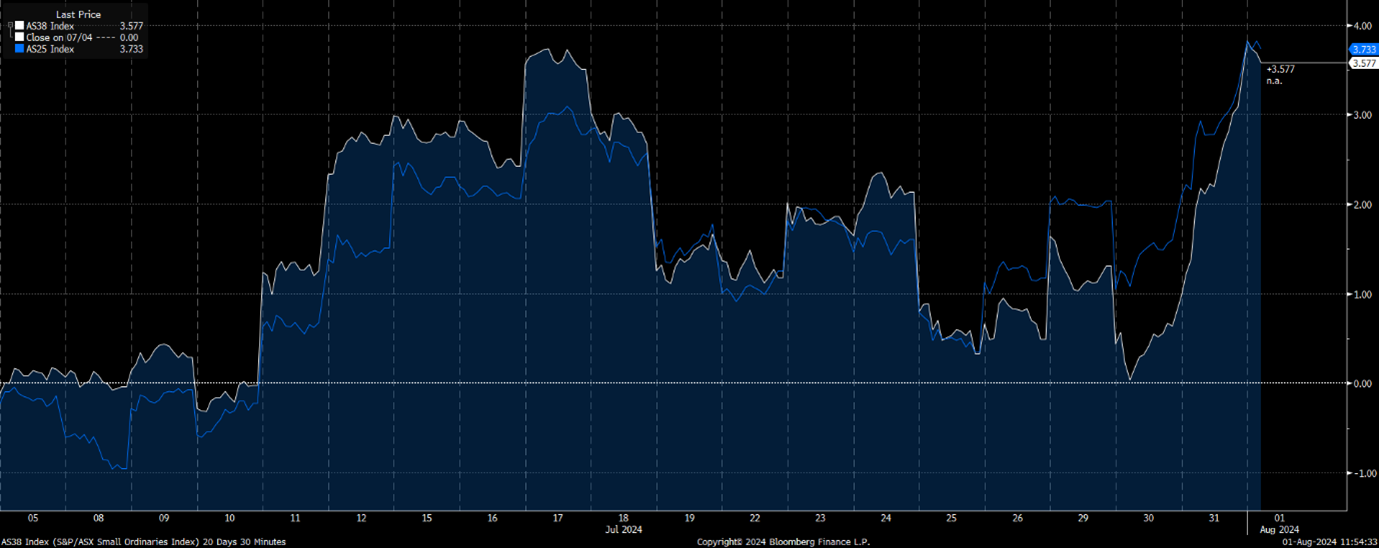
Interestingly, in Australia, we have not yet seen this play out at the index level – with Small Caps (the blue line in the chart below) only slightly ahead vs the ASX100 over the last month. 

 (Source: Internal, as at 1st August 2024)

There are probably a number of reasons why this might be the case, but typically what we are seeing transpire in the US could follow here with a lag, depending somewhat on the local interest rate cycle.

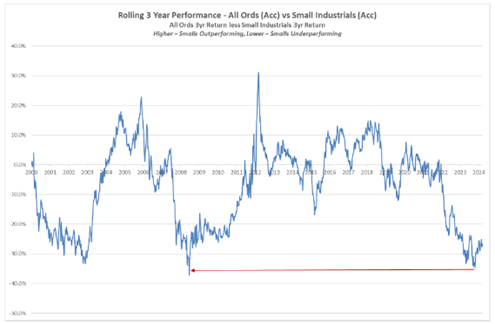
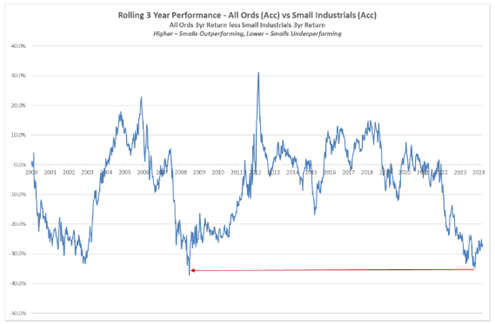
And if we do see a catch up here in Australia, the scale is likely to be quite big – given the level of underperformance we have seen over the past 3 years:

 (Source: Internal to Paradice, as at 31 July 2024)

Paradice Australian Small Cap Opportunities Fund (“SCOF” or “the Fund”) turned one on 20 July 2024

Why consider an investment in SCOF?

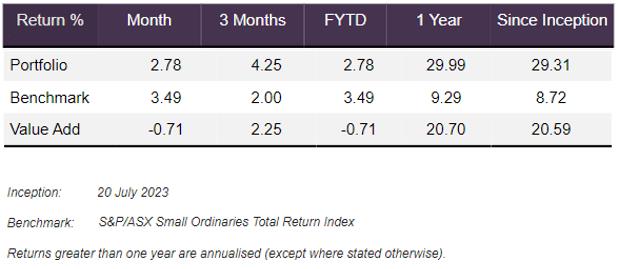
  1. Fund Performance: SCOF has performed strongly in its first 12 months; delivering 29.99% total return, 20.70% above benchmark return of 9.29% (being the S&P/ASX Small Ordinaries Total Return Index. Refer also to table below).[2]
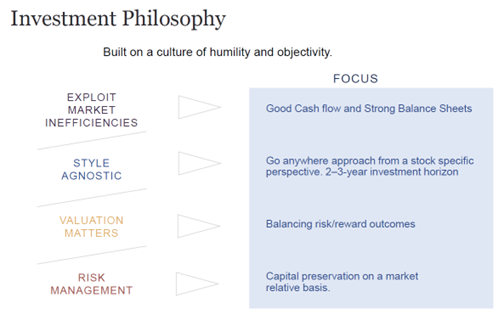
  2. Investment Philosophy/Process: SCOF employs a similar process to the original Paradice Small Cap Fund founded in 2000; which has delivered >14% p.a. total return over this time.[3]
  3. Fund Size: SCOF has a relatively small FUM allowing it to be nimble, take advantage of mispricing while focusing on capital preservation and compounding returns.
  4. Boutique Structure: As a Paradice product, SCOF is able to leverage off the wider Paradice network.
  5. The Australian Small Cap Index[4] has materially underperformed Large Caps[5] by c.25% since interest rates started rising in early 2022. With rates close to a peak; and early signs of a small cap re-rate occurring in the US; now is a good time consider investing in Australian Small Caps in our view.     

1) Fund Performance:

SCOF celebrated its one year anniversary on 20 July 2024.

For the year to 31 July 2024 the Fund delivered a c30% total return before tax, after ongoing management costs and accrued performance fees.

Details below:

31 July 2024

Past performance of the Fund is not a reliable indicator of future performance. The value of an investment in the Fund may rise or fall. Returns are not guaranteed by any person. Fund returns are calculated before tax, after ongoing management costs and any accrued performance fees (unless waived). Returns greater than 1 year are annualised.

2) Investment philosophy/process:

As at 30 June 2024, the existing Australian Small Cap Fund has returned 14.9% total gross return and 9.34% alpha per annum over 24 years.[3]

SCOF implements a similar investment philosophy to that implemented successfully by the other Paradice Funds – including the existing Australian Small Cap Fund.

3) Fund size:

SCOF is a capacity constraint product – we will limit FUM to maximise alpha generation.

Further we are at the early stage of SCOF’s life cycle, which has obvious benefits:

– increased nimbleness to trade in and out of stocks; and

– broader investment opportunities.

4) Boutique structure supported by the wider Paradice business:

The investment team behind SCOF are co-investors in the Fund alongside our clients, which creates strong alignment. SCOF can also leverage the wider Paradice funds management network. 

5) Time for Australian small caps? 

With the Australian Small Cap Index near 15-year lows; and the early stages of a potential re-rate underway in US Small Caps; now could be an opportune time to invest in Australian Small Caps. 

[1] Source: How Magnificent 7 affects S&P 500 stock market concentration (cnbc.com))
[2] Past performance of the Fund is not a reliable indicator of future performance. The value of an investment in the Fund may rise or fall. Returns are not guaranteed by any person. Fund returns are calculated before tax, after ongoing management costs and any accrued performance fees (unless waived). Returns greater than 1 year are annualised.
[3]Returns presented on a “gross” basis do not reflect any management fees, and other potential expenses to be borne by the investors. The Australian Small Cap Fund is managed by a separate investment team and is distinct from the Australian Small Cap Opportunities Fund. 
[4] The S&P/ASX Australian Small Industrials Index. 
[5]The S&P/ASX Australian All Ordinaries Index. 

Disclaimer:

This material is prepared by Paradice Investment Management Pty Ltd (ABN 64 090 148 619 AFSL No 224158) (Paradice, we or us).

This material is not intended to constitute advertising or advice (including investment advice or security, market or sector recommendations) of any kind. In addition, this material represents only the views of the Paradice Australian Small Cap Opportunities team as at the time of release and is not intended, and may not, represent the views of Paradice or any of the other investment teams at Paradice.

Equity Trustees Limited (ABN 46 004 031 298, AFSL No. 240975) (Equity Trustees) is the responsible entity of, and issuer of units in, the Paradice Australian Small Cap Opportunities Fund (Fund). Equity Trustees is a subsidiary of EQT Holdings Limited (ABN 22 607 797 615), a publicly listed company on the Australian Securities Exchange (ASX:EQT). 

It may contain certain forward looking statements, opinions and projections that are based on the assumptions and judgments of Paradice with respect to, among other things, future economic, competitive and market conditions and future business decisions, all of which are difficult or impossible to predict accurately and many of which are beyond the control of Paradice. Because of the significant uncertainties inherent in these assumptions, opinions and judgments, you should not place undue reliance on these forward looking statements. For the avoidance of doubt, any such forward looking statements, opinions, assumptions and/or judgments made by Paradice may not prove to be accurate or correct. You should perform your own research and due diligence, consult your own financial, legal, and tax advisors before making any investment decision with respect to transacting in any securities covered herein. Specific securities identified herein are not representative of all securities purchased, sold, or recommended by the Fund previously or in the future. Following publication of this material, the investment teams at Paradice may transact or continue to transact in any of the securities covered herein, and may be positive, negative or neutral at any time hereafter regardless of our initial conclusions, or opinions.

The content of this publication is current as at the date of its publication and is subject to change at any time. It does not reflect any events or changes in circumstances occurring after the date of publication. 

You should consider your own needs and objectives and consult with a licensed financial adviser when deciding whether a Paradice Fund is suitable for you. You should also read the current Product Disclosure Statement and Target Market Determination available at www.paradice.com. A Target Market Determination is a document which is required to be made available by 5 October 2021. It will describe who this financial product is likely to be appropriate for (i.e. the target market), and any conditions around how the product can be distributed to investors. It will also describe the events or circumstances where the Target Market Determination for this financial product may need to be reviewed. 

This material is not to be copied, reproduced or published at any time without the prior written consent of Paradice. Neither Paradice, Equity Trustees, nor any of their respective related parties, directors or employees, make any representation or warranty as to the accuracy, completeness, reasonableness or reliability of the information contained in this publication or accept liability or responsibility for any losses, whether direct, indirect or consequential, relating to, or arising from, the use or reliance on any part of this material. 

The information and opinions contained herein, including information obtained from third party sources which are considered to be reliable, are not necessarily all inclusive and, as such, no representation or warranty, express or implied, is made as to the accuracy, completeness or reasonableness of any assumption contained herein and no responsibility arising for errors and omissions (including responsibility to any person by reason of negligence) is accepted by Paradice, its officers, employees or agents.

Equity Trustees nor any of its related parties, their employees or directors, provide and warranty of accuracy or reliability in relation to such information or accepts any liability to any person who relies on it

Copyright© 2024 Paradice

Table of Content

Contributors:

Sam Theodore

Head of the Australian Small Cap Opportunities Fund

Michael Peet

Portfolio Manager of the Australian Small Cap Opportunities Fund

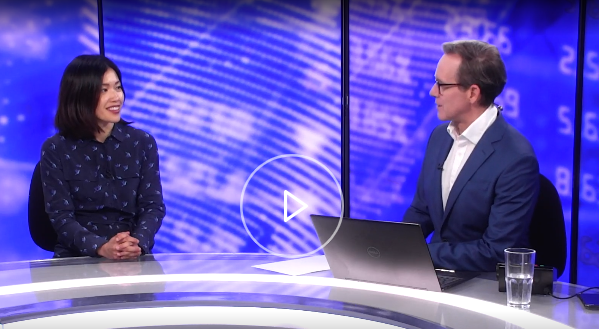
Julia Weng Speaks to Ausbiz about Rate Hikes and Market Spikes

Julia Weng Speaks to Ausbiz about Rate Hikes and Market Spikes

Portfolio Manager / Analyst from our Australian Equities team, Julia Weng, speaks to AusBiz about the potential RBA rate hikes, the Aussie dollar’s potential rebound and investment strategies.

Watch the video here.

Disclaimer:

This material (or any contribution to it) is not intended to constitute advertising or advice (including legal, tax or investment advice or security recommendation) of any kind.  It is of a general nature only and was current only at the time of initial publication. The information and opinions contained herein are not necessarily all-inclusive and, as such, no representation or warranty, express or implied, is made as to the accuracy, completeness or reasonableness of any assumption contained herein and no responsibility arising for errors and omissions (including responsibility to any person by reason of negligence) is accepted by Paradice, its officers, employees or agents.  It may contain certain forward looking statements, opinions and projections that are based on the assumptions and judgments of Paradice with respect to, among other things, future economic, competitive and market conditions and future business decisions, all of which are difficult or impossible to predict accurately and many of which are beyond the control of Paradice. Because of the significant uncertainties inherent in these assumptions, opinions and judgments, you should not place undue reliance on these forward looking statements. You should consider your own needs and objectives and consult with a licensed financial adviser. For the avoidance of doubt, any such forward looking statements, opinions, assumptions and/or judgments made by Paradice may not prove to be accurate or correct.  References to securities may or may not represent the holdings of the Paradice Funds.  The content of this publication is current as at the date of its publication and is subject to change at any time. It does not reflect any events or changes in circumstances occurring after the date of publication.

3 Preferred Materials Exposures and 1 Sector to Avoid

3 preferred materials exposures and 1 sector to avoid

In a normal cycle, high prices for commodities from high demand would lead to increased supply and finally a drop in prices – but these are far from normal times.

Tom Richardson, Lead Portfolio Manager of the Paradice Equity Alpha Plus Fund, factors like the energy transition, underinvestment in production and ongoing demand from China may see prices rise further, or at least stay higher for longer. He is the first to say this might be a dangerous view and investors should be selective about their commodities investments.

Disclaimer:

This publication is not intended to constitute advertising or advice (including investment advice or security, market or sector recommendations) of any kind. It may contain certain forward looking statements, opinions and projections that are based on the assumptions and judgments of Paradice with respect to, among other things, future economic, competitive and market conditions and future business decisions, all of which are difficult or impossible to predict accurately and many of which are beyond the control of Paradice. Because of the significant uncertainties inherent in these assumptions, opinions and judgments, you should not place undue reliance on these forward looking statements. Equity Trustees Limited (ABN 46 004 031 298, AFSL No. 240975) (Equity Trustees) is the responsible entity of, and issuer of units in, the Paradice Funds (Funds). Equity Trustees is a subsidiary of EQT Holdings Limited (ABN 22 607 797 615), a publicly listed company on the Australian Securities Exchange (ASX:EQT). You should consider your own needs and objectives and consult with a licensed financial adviser when deciding whether a Paradice Fund is suitable for you. You should also read the current Product Disclosure Statement and Target Market Determination available at www.paradice.com. References to securities may or may not represent the holdings of the Paradice Funds. For the avoidance of doubt, any such forward looking statements, opinions, assumptions and/or judgments made by Paradice may not prove to be accurate or correct. The content of this publication is current as at the date of its publication and is subject to change at any time. It does not reflect any events or changes in circumstances occurring after the date of publication.

#MeToo Momentum Continues in Australian Workplaces & Investors Must Take Note

From Parliament to the Pilbara: #MeToo momentum continues in Australian workplaces and investors must take note

Starting as a viral social media response to revelations of horrific sexual abuse allegations against influential Hollywood producer Harvey Weinstein in 2017, the #MeToo movement made the front pages for months and started serious public conversations. Conversations about everyday sexism, sexual assault and harassment of women, power dynamics in the workplace and fear of retaliation.

While the prominence of #MeToo might have died down in everyday news flow, we can’t underestimate the impact the movement has had in shining the spotlight on these issues and importantly providing a common language for women to demand better. It has also laid the ground for new voices to build upon the movement and continue momentum for change.

In Australia, the mantle has been taken up by the likes of Grace Tame and Brittany Higgins. The former, who just completed her time as Australian of the Year, has advocated for child sexual abuse survivors having been one herself at the hands of her schoolteacher. Grace’s message has also spoken to power dynamics, their role in abusive behaviour and in eliciting fear and silence from victims. Many of the public have seen that same abuse of power occur in so many settings, especially in the workplace.

Brittany Higgins, formerly a staffer in Federal Parliament, became instrumental throughout 2021 in driving community-led activism for women’s rights with the March for Justice. It saw women take to the streets and outside parliaments around Australia to demand the changes necessary so they could feel safe at work and have better legal protections.

Higgins’ advocacy prompted an independent inquiry into parliamentary workplaces led by the Sex Discrimination Commissioner Kate Jenkins, who was tasked with making recommendations on how to ensure parliamentary workplaces are safe and respectful. In November 2021 Jenkins published the report on her findings, ‘Set the Standard’. While some aspects were unique to Parliament, much of the report was applicable to all workplaces and offered insights into everyday experiences for less dominant groups, typically women.

Set the Standard identified drivers of bullying, sexual harassment and sexual assault: power imbalances and the misuse of power; inequality of gender and other non-dominant groups; and insufficient accountability for poor behaviour. This has been amplified and reinforced by unclear and inconsistent application of behavioural standards, poor leadership, negative workplace culture, and ineffectual structures for employment and promotion.

It also revealed that 1 in 3 parliamentary workers had experienced sexual harassment, and that harassment occurs at much higher rates for women compared with men (63% vs 24%). Rates are higher again for people who identify as LGBTIQ+.

Similar rates of sexual harassment have been revealed through submissions and hearings for the WA inquiry into sexual harassment against women in the fly-in/fly-out (FIFO) mining industry which commenced in July 2021. The final report is due in April this year and we expect to see further confirmation of the key drivers and risk factors relating to sexual harassment in the workplace detailed in the Jenkins report.

Despite these rumblings of under-appreciated rates of sexual harassment and bullying in Australian workplaces in recent months, when Rio Tinto this month published a landmark report into its own workplace culture it appeared to catch many by surprise. The review, led by former Sex Discrimination Commissioner Elizabeth Broderick, detailed high rates of bullying, widespread sexual harassment and racism being a common occurrence. Like Jenkins, Broderick was given a mandate to make recommendations for Rio Tinto to improve safety and inclusion in the workplace.

To Rio Tinto’s credit, it published the report in full and at the same time committed to implementing all recommendations, providing unprecedented transparency to stakeholders and importantly offered accountability. It was also an act of leadership, demonstrating an acceptance of what has come up as a common theme in these various inquiries: the role of leaders is vital. “Caring and inclusive leadership” and “setting the tone from the top” remains one of the more impactful means through which to drive meaningful workplace change.

But what now is the role of investors?

For boards and senior executives of listed companies it would be foolish – if not dangerous – to assume their workplace is free from bullying and sexual harassment. The rates at which this occurs amongst the general population would indicate it’s statistically improbable they are unimpacted. Further, the Jenkins parliamentary and the WA FIFO inquiries have demonstrated that certain workplaces face elevated risks. For example, those workplaces where power imbalances may be amplified; are male-dominated; and where socialising outside of work hours is more common (which can blur professional boundaries).

Investors must ensure that the boards and executives of their investee companies are reconsidering how they understand and monitor their workplace cultures. It is the role of an investor to be sceptical of claims that “it’s all in hand”. This is especially the case as all of these inquiries have revealed that victims so often fear speaking up and reporting harmful behaviour. How can a company be so sure, then, that those behaviours aren’t occurring?

This requires a new approach to understanding the workplace, its culture and the barriers to creating safe and inclusive environments for employees. Investors should be challenging companies to not solely rely on voluntary reporting through mistrusted channels and instead ask how companies can innovate to elicit relevant information from staff to get a more accurate ‘sense check’ of the state of play with respect to bullying and harassment.

As the Rio Tinto report highlighted, both formal and informal channels are needed to safely call out poor behaviour. This includes encouraging all staff to be “active bystanders” and, for example, not stay silent should a colleague make a sexist remark. Further, options for reporting should be reinforced by actions which give employees confidence that there are consequences for perpetrators and victims are protected.

Investors should also challenge investee companies’ approach to leadership and encourage training and capability building relating to caring and inclusive leadership styles. At a minimum this should be for the most senior leaders, but preferably middle management as it is this group which is often at the frontline in responding to instances of poor behaviour and “living” the culture of the company.

While many companies won’t be as well-resourced as Rio Tinto to undertake a multi-month review, there are still improvements every company can make to improve safety and inclusion for all their staff. With investors being afforded influence through their shareholding, they should push companies to see what can be done within their operations.

Failure to make safe and inclusive workplaces can not only have serious and long lasting negative impacts upon the victims of the resultant bullying, sexual harassment or assault, it results in poor business outcomes such as loss of productivity or challenges in attracting the best talent. While investors should be morally concerned with any harm caused to individuals, when there is also a clear potential for value destruction, they must act to ensure companies are managing this issue appropriately.

Written by: Maddy Dwyer and Nick Varcoe, Paradice ESG

Disclaimer:

This material (or any contribution to it) is not intended to constitute advertising or advice (including legal, tax or investment advice or security recommendation) of any kind.  It is of a general nature only and was current only at the time of initial publication. The information and opinions contained herein are not necessarily all-inclusive and, as such, no representation or warranty, express or implied, is made as to the accuracy, completeness or reasonableness of any assumption contained herein and no responsibility arising for errors and omissions (including responsibility to any person by reason of negligence) is accepted by Paradice, its officers, employees or agents.  It may contain certain forward looking statements, opinions and projections that are based on the assumptions and judgments of Paradice with respect to, among other things, future economic, competitive and market conditions and future business decisions, all of which are difficult or impossible to predict accurately and many of which are beyond the control of Paradice. Because of the significant uncertainties inherent in these assumptions, opinions and judgments, you should not place undue reliance on these forward looking statements. You should consider your own needs and objectives and consult with a licensed financial adviser. For the avoidance of doubt, any such forward looking statements, opinions, assumptions and/or judgments made by Paradice may not prove to be accurate or correct.  References to securities may or may not represent the holdings of the Paradice Funds.  The content of this publication is current as at the date of its publication and is subject to change at any time. It does not reflect any events or changes in circumstances occurring after the date of publication.

Subscribe to our newsletter for updates.

logo-black

Welcome to Paradice Investment Management

Visit our site for individuals and financial advisors.

Visit our site for institutional investors.